from dsc80_utils import *
# Used for plotting examples.
def create_kde_plotly(df, group_col, group1, group2, vals_col, title=''):
fig = ff.create_distplot(
hist_data=[df.loc[df[group_col] == group1, vals_col], df.loc[df[group_col] == group2, vals_col]],
group_labels=[group1, group2],
show_rug=False, show_hist=False,
colors=['#ef553b', '#636efb'],
)
return fig.update_layout(title=title)
Agenda 📆
- Missingness mechanisms.
- Why do data go missing?
- Missing by Design.
- Missing Not at Random.
- Missing Completely at Random.
- Missing at Random.
- Formal definitions.
- Identifying missingness mechanisms in data.
Additional resources
These recent lectures have been quite conceptual! Here are a few other places to look for readings; many of these are linked on the course homepage and on the Resources tab of the course website.
- Permutation testing:
- Extra lecture notebook: Fast Permutation Tests.
- Great visualization from Jared Wilber.
- Missingness mechanisms:
Missingness mechanisms
Imperfect data

When studying a problem, we are interested in understanding the true model in nature.
The data generating process is the "real-world" version of the model, that generates the data that we observe.
The recorded data is supposed to "well-represent" the data generating process, and subsequently the true model.
Example: Consider the upcoming Midterm Exam (in two weeks).
- The exam is meant to be a model of your true knowledge of DSC 80 concepts.
- The data generating process should give us a sense of your true knowledge, but is influenced by the specific questions on the exam, your preparation for the exam, whether or not you are sick on the day of the exam, etc.
- The recorded data consists of the final answers you write on the exam page.
Imperfect data

Problem 1: Your data is not representative, i.e. you have a poor access frame and/or collected a poor sample.
- If the exam only asked questions about
pivot_table, that would not give us an accurate picture of your understanding of DSC 80!
- If the exam only asked questions about
Problem 2: Some of the entries are missing.
- If you left some questions blank, why?
We will focus on the second problem.
Types of missingness
There are four key ways in which values can be missing. It is important to distinguish between these types since in some cases, we can impute (fill in) the missing data.
- Missing by design (MD).
- Missing not at random (MNAR).
- Also called "non-ignorable" (NI).
- Missing at random (MAR).
- Missing completely at random (MCAR).
Missing by design (MD)
Values in a column are missing by design if:
- the designers of the data collection process intentionally decided to not collect data in that column,
- because it can be recovered from other columns.
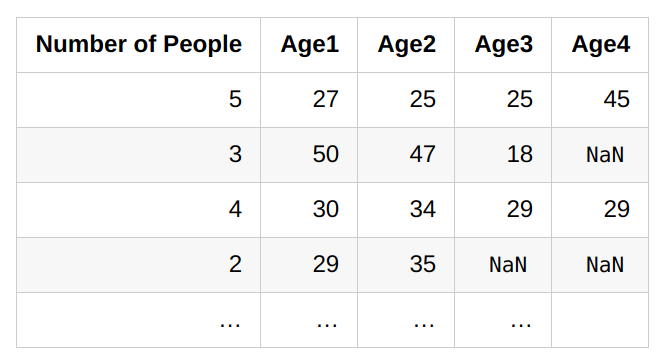
If you can determine whether a value is missing solely using other columns, then the data is missing by design.
- For example:
'Age4'is missing if and only if'Number of People'is less than 4.
- For example:
Refer to this StackExchange link for more examples.
Missing by design

Example: 'Car Type?' and 'Car Colour?' are missing if and only if 'Own a car?' is 'No'.
Other types of missingness
Missing not at random (MNAR).
- The chance that a value is missing depends on the actual missing value!
Missing completely at random (MCAR).
- The chance that a value is missing is completely independent of
- other columns, and
- the actual missing value.
- The chance that a value is missing is completely independent of
Missing at random (MAR).
- The chance that a value is missing depends on other columns, but not the actual missing value itself.
- If a column is MAR, then it is MCAR when conditioned on some set of other columns.
Mom... the dog ate my data! 🐶
Consider the following (contrived) example:
- We survey 100 people for their favorite color and birth month.
- We write their answers on index cards.
- On the left side, we write colors.
- On the right side, we write birth months 📆.
- A silly dog takes the top 10 cards from the stack and chews off the right side (birth months).
- Now ten people are missing birth months!
Question 🤔
We are now missing birth months for the first 10 people we surveyed. What is the missingness mechanism for birth months if:
- Cards were sorted by favorite color?
- Cards were sorted by birth month?
- Cards were shuffled?
Remember:
- Missing not at random (MNAR): The chance that a value is missing depends on the actual missing value!
- Missing at random (MAR): The chance that a value is missing depends on other columns, but not the actual missing value itself.
- Missing completely at random (MCAR): The chance that a value is missing is completely independent of other columns and the actual missing value.
The real world is messy! 🌎
- In our contrived example, the distinction between MNAR, MAR, and MCAR was relatively clear.
- However, in more practical examples, it can be hard to distinguish between types of missingness.
- Domain knowledge is often needed to understand why values might be missing.
Missing not at random (MNAR)
Data is MNAR if the chance that a value is missing depends on the actual missing value!
- It could also depend on other columns.
Another term for MNAR is "non-ignorable" – the fact that data is missing gives information that we cannot ignore.
Example: A person doesn't take a drug test because they took drugs the day before.
Example: On an employment survey, people with really high incomes may be less likely to disclose their income.
- If we ignore missingness and compute the mean salary, our result will be biased low!
Example: In public opinion research, people with weaker opinions respond less. The results can be biased towards extremes.
When data is MNAR, we must reason about why the data is missing using domain expertise on the data generating process – the other columns in our data won't help.
Missing completely at random (MCAR)
Data is MCAR if the chance that a value is missing is completely independent of other columns and the actual missing value.
Example: After the Midterm Exam, I accidentally spill tea on the top of the stack. Assuming that the exams are in a random order, the exam scores that are lost due to this still will be MCAR. (Hopefully this doesn't happen!)

Missing at random (MAR)
Data is MAR if the chance that a value is missing depends on other columns, but not the actual missing value itself.
Example: People who work in the service industry may be less likely to report their income. Why?
- If you look at service industry workers only, there is no pattern to the missingness of income (MCAR).
- If you look at other industries (say, corporate workers only), there is no pattern to the missingness of income (MCAR).
- Within each industry, missingness is MCAR, but overall, it is MAR, since the missingness of income depends on industry.
- Example: An elementary school teacher keeps track of the health conditions and grades of each student in their class. One day, a student misses school because they're sick and therefore, they don't have a score for the math test administered that day.
- The fact that their test score is missing has nothing to do with the test score itself.
- But the teacher could have predicted that the score would have been missing given the other information they had about the student.
Isn't everything MNAR? 🤔
You can argue that many of these examples are MNAR, by arguing that the missingness depends on the value of the data that is missing.
- For example, if a student is sick, they may have health problems and be less likely to attend school, making them perform worse on tests in general.
Fair point, but with that logic almost everything is MNAR. What we really care about is the main reason data is missing.
If the other columns mostly explain the missing value and missingness, treat it as MAR.
In other words, accounting for potential confounding variables makes MNAR data more like MAR.
- This is a big part of experimental design.
Flowchart
A good strategy is to assess missingness in the following order.
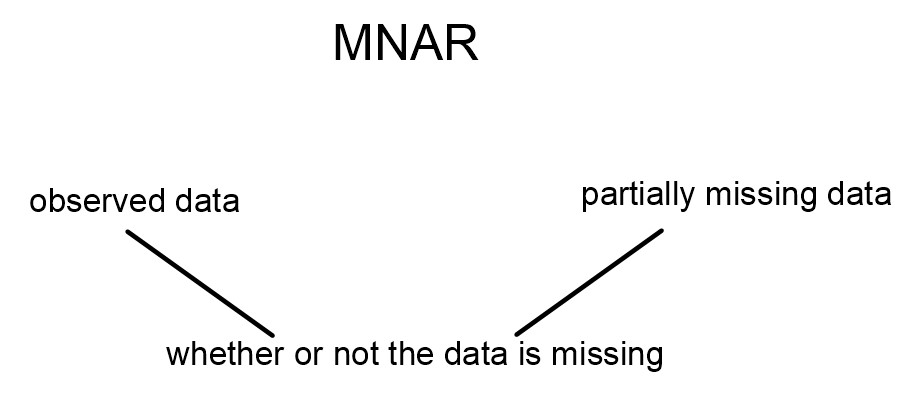
MNAR diagram
For MNAR data, the missingness is connected to the partially missing data (and also, perhaps, to the fully observed data).

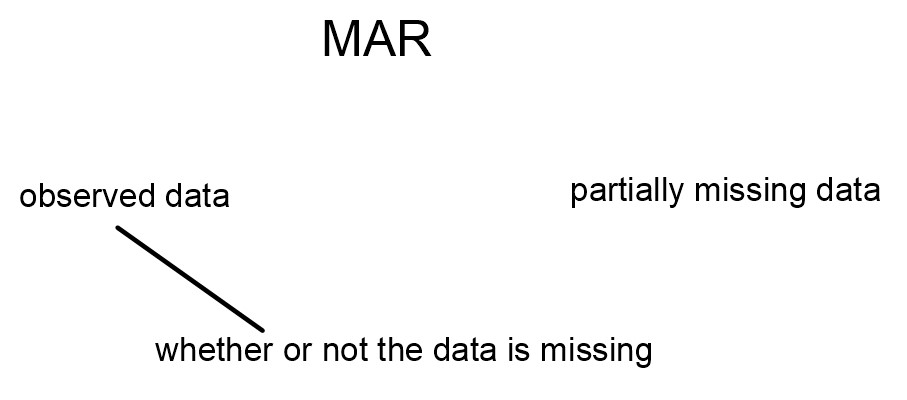
MAR diagram
For MAR data, the missingness is not connected to the partially missing data, but it is connected to the observed data.

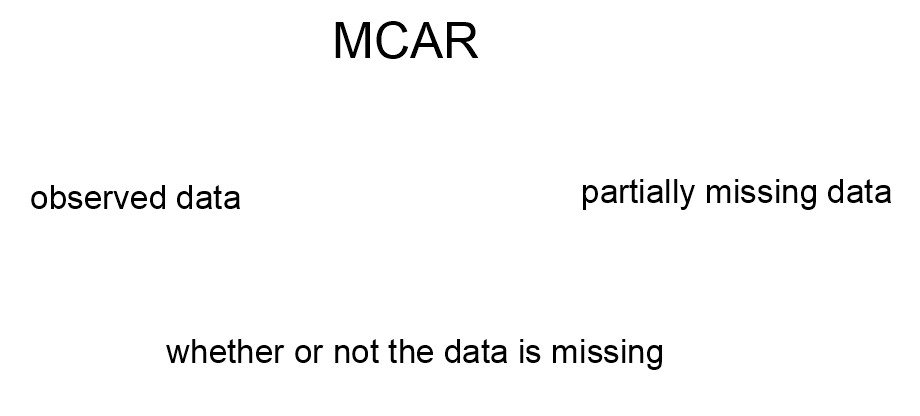
MCAR diagram
For MCAR data, we get no information about missingness from the observed data or the partially missing data.

Question 🤔
In each of the following examples, decide whether the missing data are likely to be MD, MNAR, MAR, or MCAR:
- A table for a medical study has columns for
'gender'and'age'.'age'has missing values. - Measurements from the Hubble Space Telescope are dropped during transmission.
- A table has a single column,
'self-reported education level', which contains missing values. - A table of grades contains three columns,
'Midterm Version A','Midterm Version B', and'Midterm Version C'. $\frac{2}{3}$ of the entries in the table areNaN.
Why do we care again?
- If a dataset contains missing values, it is likely not an accurate picture of the data generating process.
- By identifying missingness mechanisms, we can best fill in missing values, to gain a better understanding of the data generating process.
Formal definitions
We won't spend much time on these in lecture, but you may find them helpful.
Suppose we have:
- A dataset $Y$ with observed values $Y_{obs}$ and missing values $Y_{mis}$.
Data is missing completely at random (MCAR) if
$$\text{P}(\text{data is present} \: | \: Y_{obs}, Y_{mis}) = \text{P}(\text{data is present})$$
In other words, the chance that a missing value appears doesn't depend on our data (missing or otherwise).
Data is missing at random (MAR) if
$$\text{P}(\text{data is present} \: | \: Y_{obs}, Y_{mis}) = \text{P}(\text{data is present} \: | \: Y_{obs})$$
That is, MAR data is actually MCAR, conditional on $Y_{obs}$.
Data is missing not at random (MNAR) if
$$\text{P}(\text{data is present} \: | \: Y_{obs}, Y_{mis})$$
cannot be simplified. That is, in MNAR data, missingness is dependent on the missing value itself.
Identifying missingness mechanisms in data
Identifying missingness mechanisms in data
- Suppose I believe that the missingness mechanism of a column is MNAR, MAR, or MCAR.
- I've ruled out missing by design (a good first step).
- Can looking at the data help me determine the missingness mechanism?
Assessing MNAR
We can't determine if data is MNAR just by looking at the data, as whether or not data is MNAR depends on the unobserved data.
To establish if data is MNAR, we must:
- reason about the data generating process, or
- collect more data.
Example: Consider a dataset of survey data of students' self-reported happiness. The data contains PIDs and happiness scores; nothing else. Some happiness scores are missing. Are happiness scores likely MNAR?
Assessing MAR
Data is MAR if the missingness only depends on observed data.
After reasoning about the data generating process, if you assume that data is not MNAR, then it must be either MAR or MCAR.
The more columns we have in our dataset that are correlated with missingness, the "weaker the MNAR effect" is.
- Adding more columns -> controlling for more variables -> moving from MNAR to MAR.
- Example: With no other columns, income in a census is MNAR. But once we look at location, education, and occupation, incomes are closer to being MAR.
Deciding between MCAR and MAR
For data to be MCAR, the chance that values are missing should not depend on any other column or the values themselves.
Example: Consider a dataset of phones, in which we store the screen size and price of each phone. Some prices are missing.
| Phone | Screen Size | Price |
|---|---|---|
| iPhone 15 | 6.3 | 999 |
| Galaxy Z Flip7 | 6.9 | NaN |
| Pixel 10 Pro | 6.3 | 999 |
| Galaxy S25 Ultra | 6.9 | NaN |
If prices are MCAR, then the distribution of screen size should be the same for:
- phones whose prices are missing, and
- phones whose prices aren't missing.
We can use a permutation test to decide between MAR and MCAR! We are asking the question, did these two samples come from the same underlying distribution?
Deciding between MCAR and MAR
Suppose you have a DataFrame with columns named $\text{col}_1$, $\text{col}_2$, ..., $\text{col}_k$, and want to test whether values in $\text{col}_X$ are MCAR. To test whether $\text{col}_X$'s missingness is independent of all other columns in the DataFrame:
For $i = 1, 2, ..., k$, where $i \neq X$:
Look at the distribution of $\text{col}_i$ when $\text{col}_X$ is missing.
Look at the distribution of $\text{col}_i$ when $\text{col}_X$ is not missing.
Check if these two distributions are the same. (What do we mean by "the same"?)
If so, then $\text{col}_X$'s missingness doesn't depend on $\text{col}_i$.
If not, then $\text{col}_X$ is MAR dependent on $\text{col}_i$.
If all pairs of distributions were the same, then $\text{col}_X$ is MCAR.
Example: Heights
- Let's load in Galton's dataset containing the heights of adult children and their parents (which you may have seen in DSC 10).
- The dataset does not contain any missing values – we will artifically introduce missing values such that the values are MCAR, for illustration.
heights_path = Path('data') / 'midparent.csv'
heights = (pd.read_csv(heights_path)
.rename(columns={'childHeight': 'child'})
[['father', 'mother', 'gender', 'child']])
heights.head()
| father | mother | gender | child | |
|---|---|---|---|---|
| 0 | 78.5 | 67.0 | male | 73.2 |
| 1 | 78.5 | 67.0 | female | 69.2 |
| 2 | 78.5 | 67.0 | female | 69.0 |
| 3 | 78.5 | 67.0 | female | 69.0 |
| 4 | 75.5 | 66.5 | male | 73.5 |
Proof that there aren't currently any missing values in heights:
heights.isna().sum()
father 0 mother 0 gender 0 child 0 dtype: int64
We have three numerical columns – 'father', 'mother', and 'child'. Let's visualize them simultaneously.
fig = px.scatter_matrix(heights.drop(columns=['gender']))
fig
Simulating MCAR data
- We will make
'child'MCAR by taking a random subset ofheightsand setting the corresponding'child'heights tonp.NaN. - This is equivalent to flipping a (biased) coin for each row.
- If heads, we delete the
'child'height.
- If heads, we delete the
- You would never do this in practice!
np.random.seed(42) # So that we get the same results each time (for lecture).
heights_mcar = heights.copy()
idx = heights_mcar.sample(frac=0.3).index
heights_mcar.loc[idx, 'child'] = np.nan
heights_mcar.head(10)
| father | mother | gender | child | |
|---|---|---|---|---|
| 0 | 78.5 | 67.0 | male | 73.2 |
| 1 | 78.5 | 67.0 | female | 69.2 |
| 2 | 78.5 | 67.0 | female | NaN |
| ... | ... | ... | ... | ... |
| 7 | 75.5 | 66.5 | female | NaN |
| 8 | 75.0 | 64.0 | male | 71.0 |
| 9 | 75.0 | 64.0 | female | 68.0 |
10 rows × 4 columns
heights_mcar.isna().mean()
father 0.0 mother 0.0 gender 0.0 child 0.3 dtype: float64
Verifying that child heights are MCAR in heights_mcar
- Each row of
heights_mcarbelongs to one of two groups:- Group 1:
'child'is missing. - Group 2:
'child'is not missing.
- Group 1:
heights_mcar['child_missing'] = heights_mcar['child'].isna()
heights_mcar.head()
| father | mother | gender | child | child_missing | |
|---|---|---|---|---|---|
| 0 | 78.5 | 67.0 | male | 73.2 | False |
| 1 | 78.5 | 67.0 | female | 69.2 | False |
| 2 | 78.5 | 67.0 | female | NaN | True |
| 3 | 78.5 | 67.0 | female | 69.0 | False |
| 4 | 75.5 | 66.5 | male | 73.5 | False |
- We need to look at the distributions of every other column –
'gender','mother', and'father'– separately for these two groups, and check to see if they are similar.
Comparing null and non-null 'child' distributions for 'gender'
gender_dist = (
heights_mcar
.assign(child_missing=heights_mcar['child'].isna())
.pivot_table(index='gender', columns='child_missing', aggfunc='size')
)
# Added just to make the resulting pivot table easier to read.
gender_dist.columns = ['child_missing = False', 'child_missing = True']
gender_dist = gender_dist / gender_dist.sum()
gender_dist
| child_missing = False | child_missing = True | |
|---|---|---|
| gender | ||
| female | 0.49 | 0.48 |
| male | 0.51 | 0.52 |
- Note that here, each column is a separate distribution that adds to 1.
- The two columns look similar, which is evidence that
'child''s missingness does not depend on'gender'.- Knowing that the child is
'female'doesn't make it any more or less likely that their height is missing than knowing if the child is'male'.
- Knowing that the child is
Comparing null and non-null 'child' distributions for 'gender'
In the previous slide, we saw that the distribution of
'gender'is similar whether or not'child'is missing.To make precise what we mean by "similar", we can run a permutation test. We are comparing two distributions:
- The distribution of
'gender'when'child'is missing. - The distribution of
'gender'when'child'is not missing.
- The distribution of
What test statistic do we use to compare categorical distributions?
gender_dist.plot(kind='barh', title='Gender by Missingness of Child Height', barmode='group')
To measure the "distance" between two categorical distributions, we use the total variation distance.
Note that with only two categories, the TVD is the same as the absolute difference in proportions for either category.
Simulation
The code to run our simulation largely looks the same as in previous permutation tests. Remember, we are comparing two distributions:
- The distribution of 'gender' when 'child' is missing.
- The distribution of 'gender' when 'child' is not missing.
n_repetitions = 500
shuffled = heights_mcar.copy()
tvds = []
for _ in range(n_repetitions):
# Shuffling genders.
# Note that we are assigning back to the same DataFrame for performance reasons;
# see https://dsc80.com/resources/lectures/lec07/lec07-fast-permutation-tests.html.
shuffled['gender'] = np.random.permutation(shuffled['gender'])
# Computing and storing the TVD.
pivoted = (
shuffled
.pivot_table(index='gender', columns='child_missing', aggfunc='size')
)
pivoted = pivoted / pivoted.sum()
tvd = pivoted.diff(axis=1).iloc[:, -1].abs().sum() / 2
tvds.append(tvd)
observed_tvd = gender_dist.diff(axis=1).iloc[:, -1].abs().sum() / 2
observed_tvd
np.float64(0.009196155526430771)
Results
fig = px.histogram(pd.DataFrame(tvds), x=0, nbins=50, histnorm='probability',
title='Empirical Distribution of the TVD')
fig.add_vline(x=observed_tvd, line_color='red', line_width=2, opacity=1)
fig.add_annotation(text=f'<span style="color:red">Observed TVD = {round(observed_tvd, 2)}</span>',
x=2.5 * observed_tvd, showarrow=False, y=0.16)
fig.update_layout(yaxis_range=[0, 0.2])
(np.array(tvds) >= observed_tvd).mean()
np.float64(0.838)
- We fail to reject the null.
- Recall, the null stated that the distribution of
'gender'when'child'is missing is the same as the distribution of'gender'when'child'is not missing. - Hence, this test does not provide evidence that the missingness in the
'child'column is dependent on'gender'.
Comparing null and non-null 'child' distributions for 'father'
We again must compare two distributions:
- The distribution of
'father'when'child'is missing. - The distribution of
'father'when'child'is not missing.
- The distribution of
If the distributions are similar, we conclude that the missingness of
'child'is not dependent on the height of the'father'.We can again use a permutation test.
px.histogram(heights_mcar, x='father', color='child_missing', histnorm='probability', marginal='box',
title="Father's Height by Missingness of Child Height", barmode='overlay', opacity=0.7)
We can visualize numerical distributions with histograms, or with kernel density estimates. (See the definition of create_kde_plotly at the top of the notebook if you're curious as to how these are created.)
create_kde_plotly(heights_mcar, 'child_missing', True, False, 'father',
"Father's Height by Missingness of Child Height")
Concluding that 'child' is MCAR
We need to run three permutation tests – one for each column in
heights_mcarother than'child'.For every other column, if we fail to reject the null that the distribution of the column when
'child'is missing is the same as the distribution of the column when'child'is not missing, then we can conclude'child'is MCAR.- In such a case, its missingness is not tied to any other columns.
- For instance, children with shorter fathers are not any more likely to have missing heights than children with taller fathers.
Summary, next time
Summary
- Refer to the Flowchart for an overview of the four missingness mechanisms.
- We can use permutation tests to verify if a column is MAR vs. MCAR.
- Create two groups: one where values in a column are missing, and another where values in a column aren't missing.
- To test the missingness of column X:
- For every other column, test the null hypothesis "the distribution of (other column) is the same when column X is missing and when column X is not missing."
- If you fail to reject the null, then column X's missingness does not depend on (other column).
- If you reject the null, then column X is MAR dependent on (other column).
- If you fail to reject the null for all other columns, then column X is MCAR!
Next time
- More examples of deciding between MCAR and MAR using permutation tests.
- For instance, we'll simulate MAR data and see if we can detect whether it is MAR.
- We'll also learn about a new test statistic for measuring the similarity between two categorical distributions.
- Imputation: given that we know a column's missingness mechanism, how do we fill in its missing values?