from dsc80_utils import *
Agenda
- Who are we?
- What does a data scientist do?
- What is this course about, and how will it run?
- The data science lifecycle.
- Example: What's in a name?
Instructor: Prof. Tauhidur Rahman

Assistant Professor, HDSI, UCSD
Website: https://mosaic-laboratory.github.io
PhD from Cornell University in Information Sciences
MSc from University of Texas at Dallas in Electrical Engineering
Research Interest: Large-scale mobile sensor data, wearables, ambient sensing, mobile health
I love to sing, play, read and cook with my twins and do scratch coding with them.
In the past, I was a vocalist of a band.
Tell me about you! Use the Class[Buzz] code: intro-q
Course staff
In addition to the instructor, we have several staff members who are here to help you in discussion, office hours, and on Piazza:
- 1 graduate student TA: Tanjid Hasan Tonmoy.
- N undergraduate tutors: TBD!
Learn more about them at dsc80.com/staff.
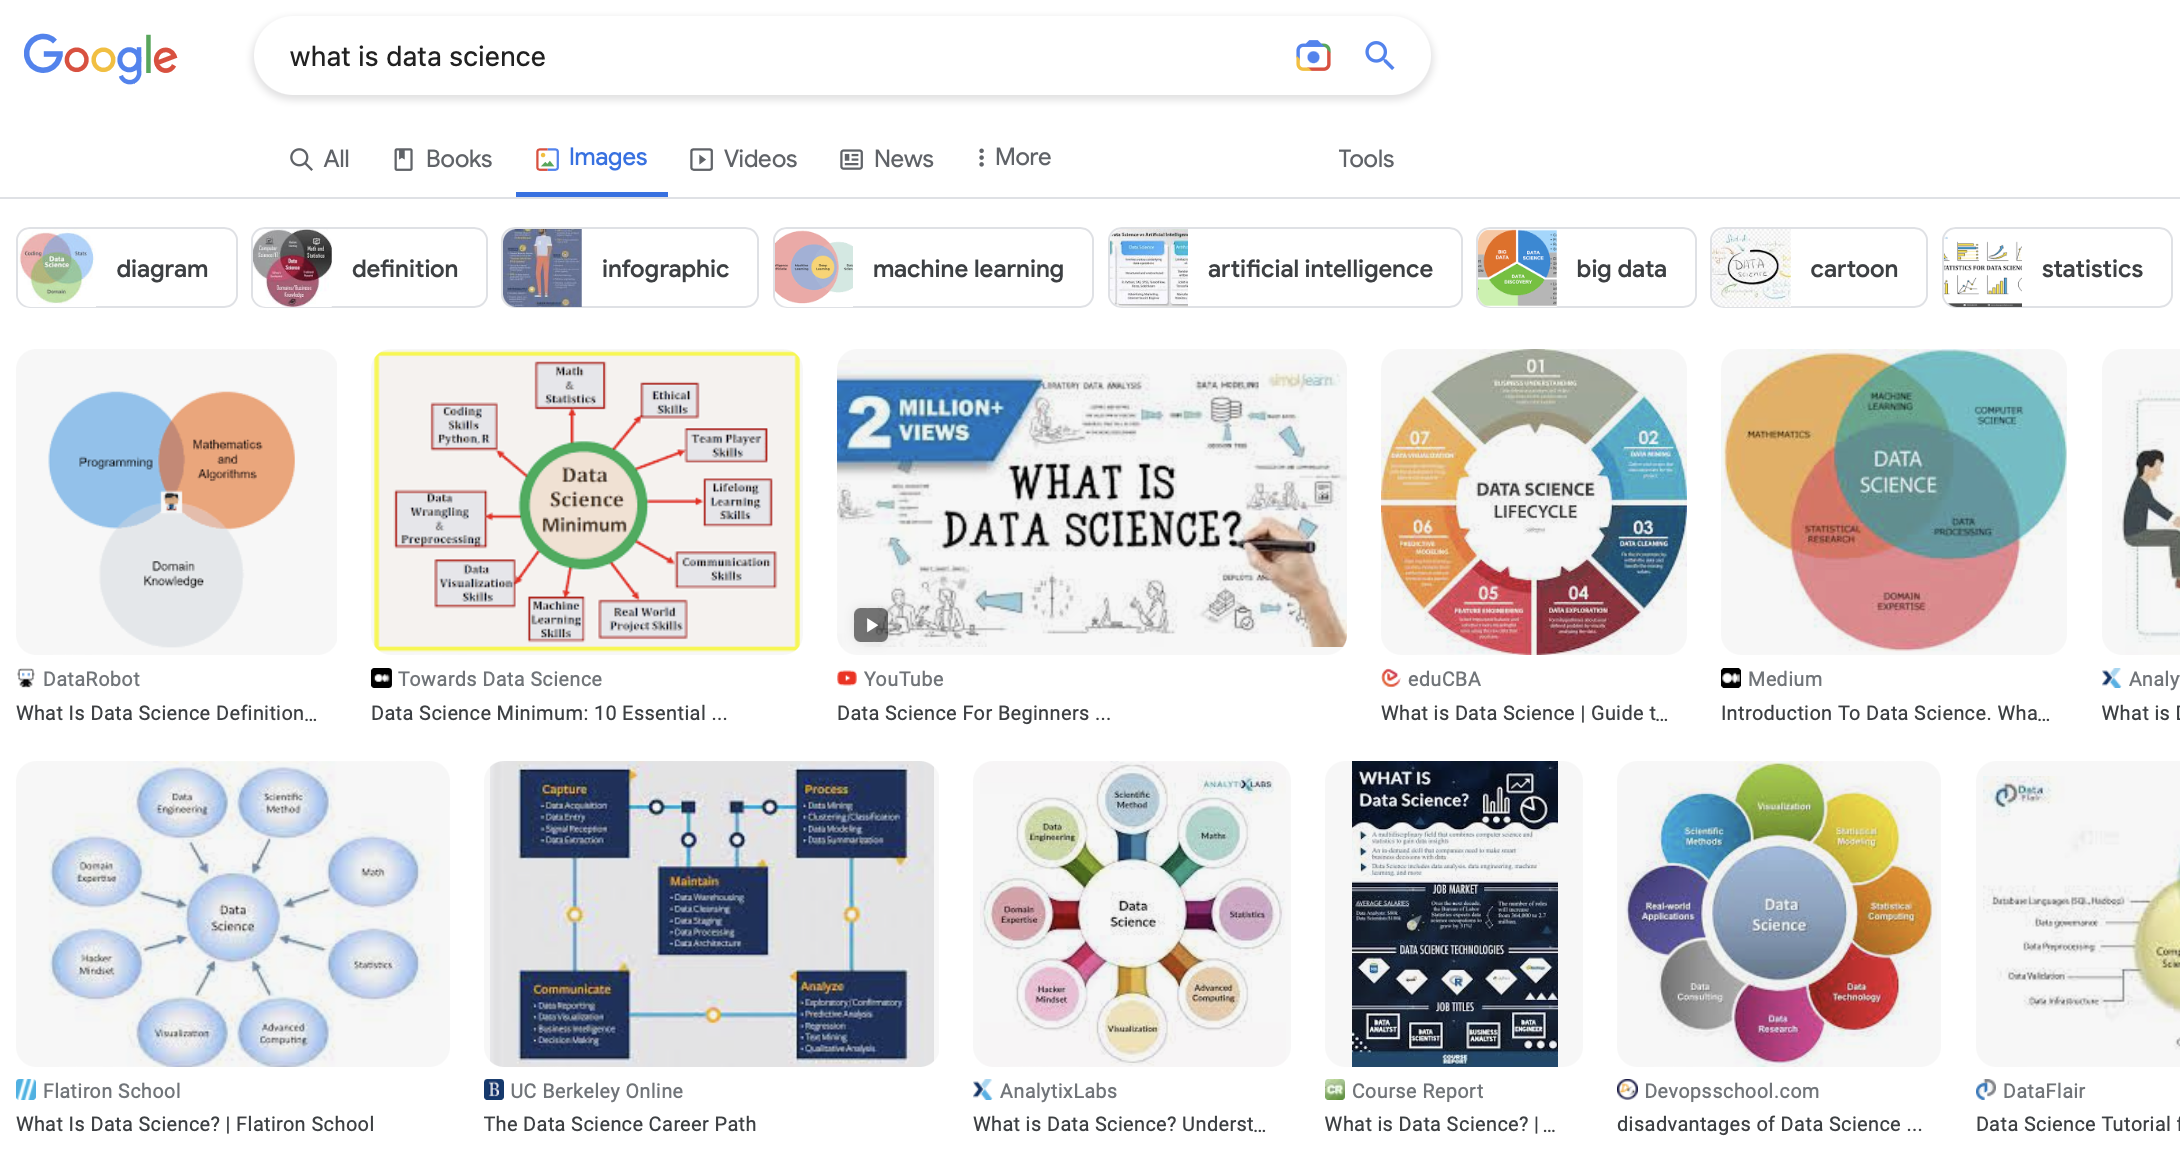
What is data science? 🤔
The DSC 10 approach
In DSC 10, we told you that data science is about drawing useful conclusions from data using computation. In DSC 10, you:
- Used Python to explore and visualize data.
- Used simulation to make inferences about a population, given just a sample.
- Made predictions about the future given data from the past.
Let's look at a few more definitions of data science.
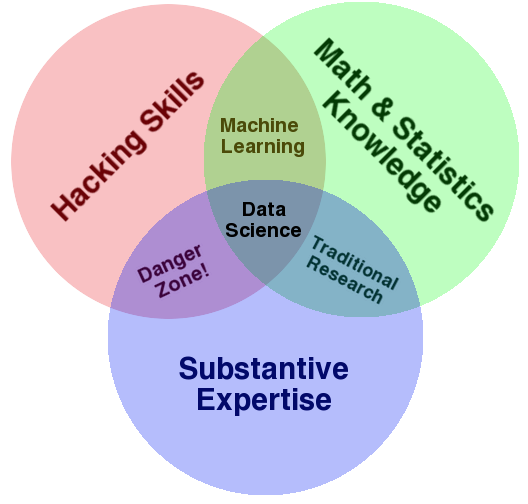
What is data science?
There isn't agreement on which "Venn Diagram" is correct!
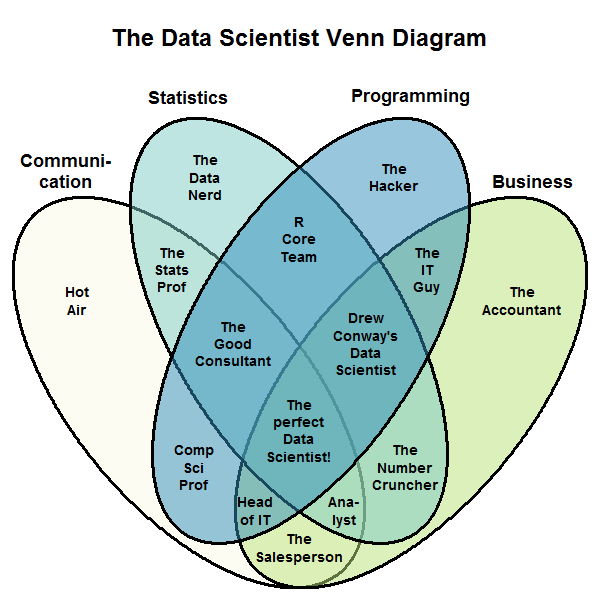
- Why not? The field is new and rapidly developing.
- Make sure you're solid on the fundamentals, then find a niche that you enjoy.
- Read Taylor, Battle of the Data Science Venn Diagrams.
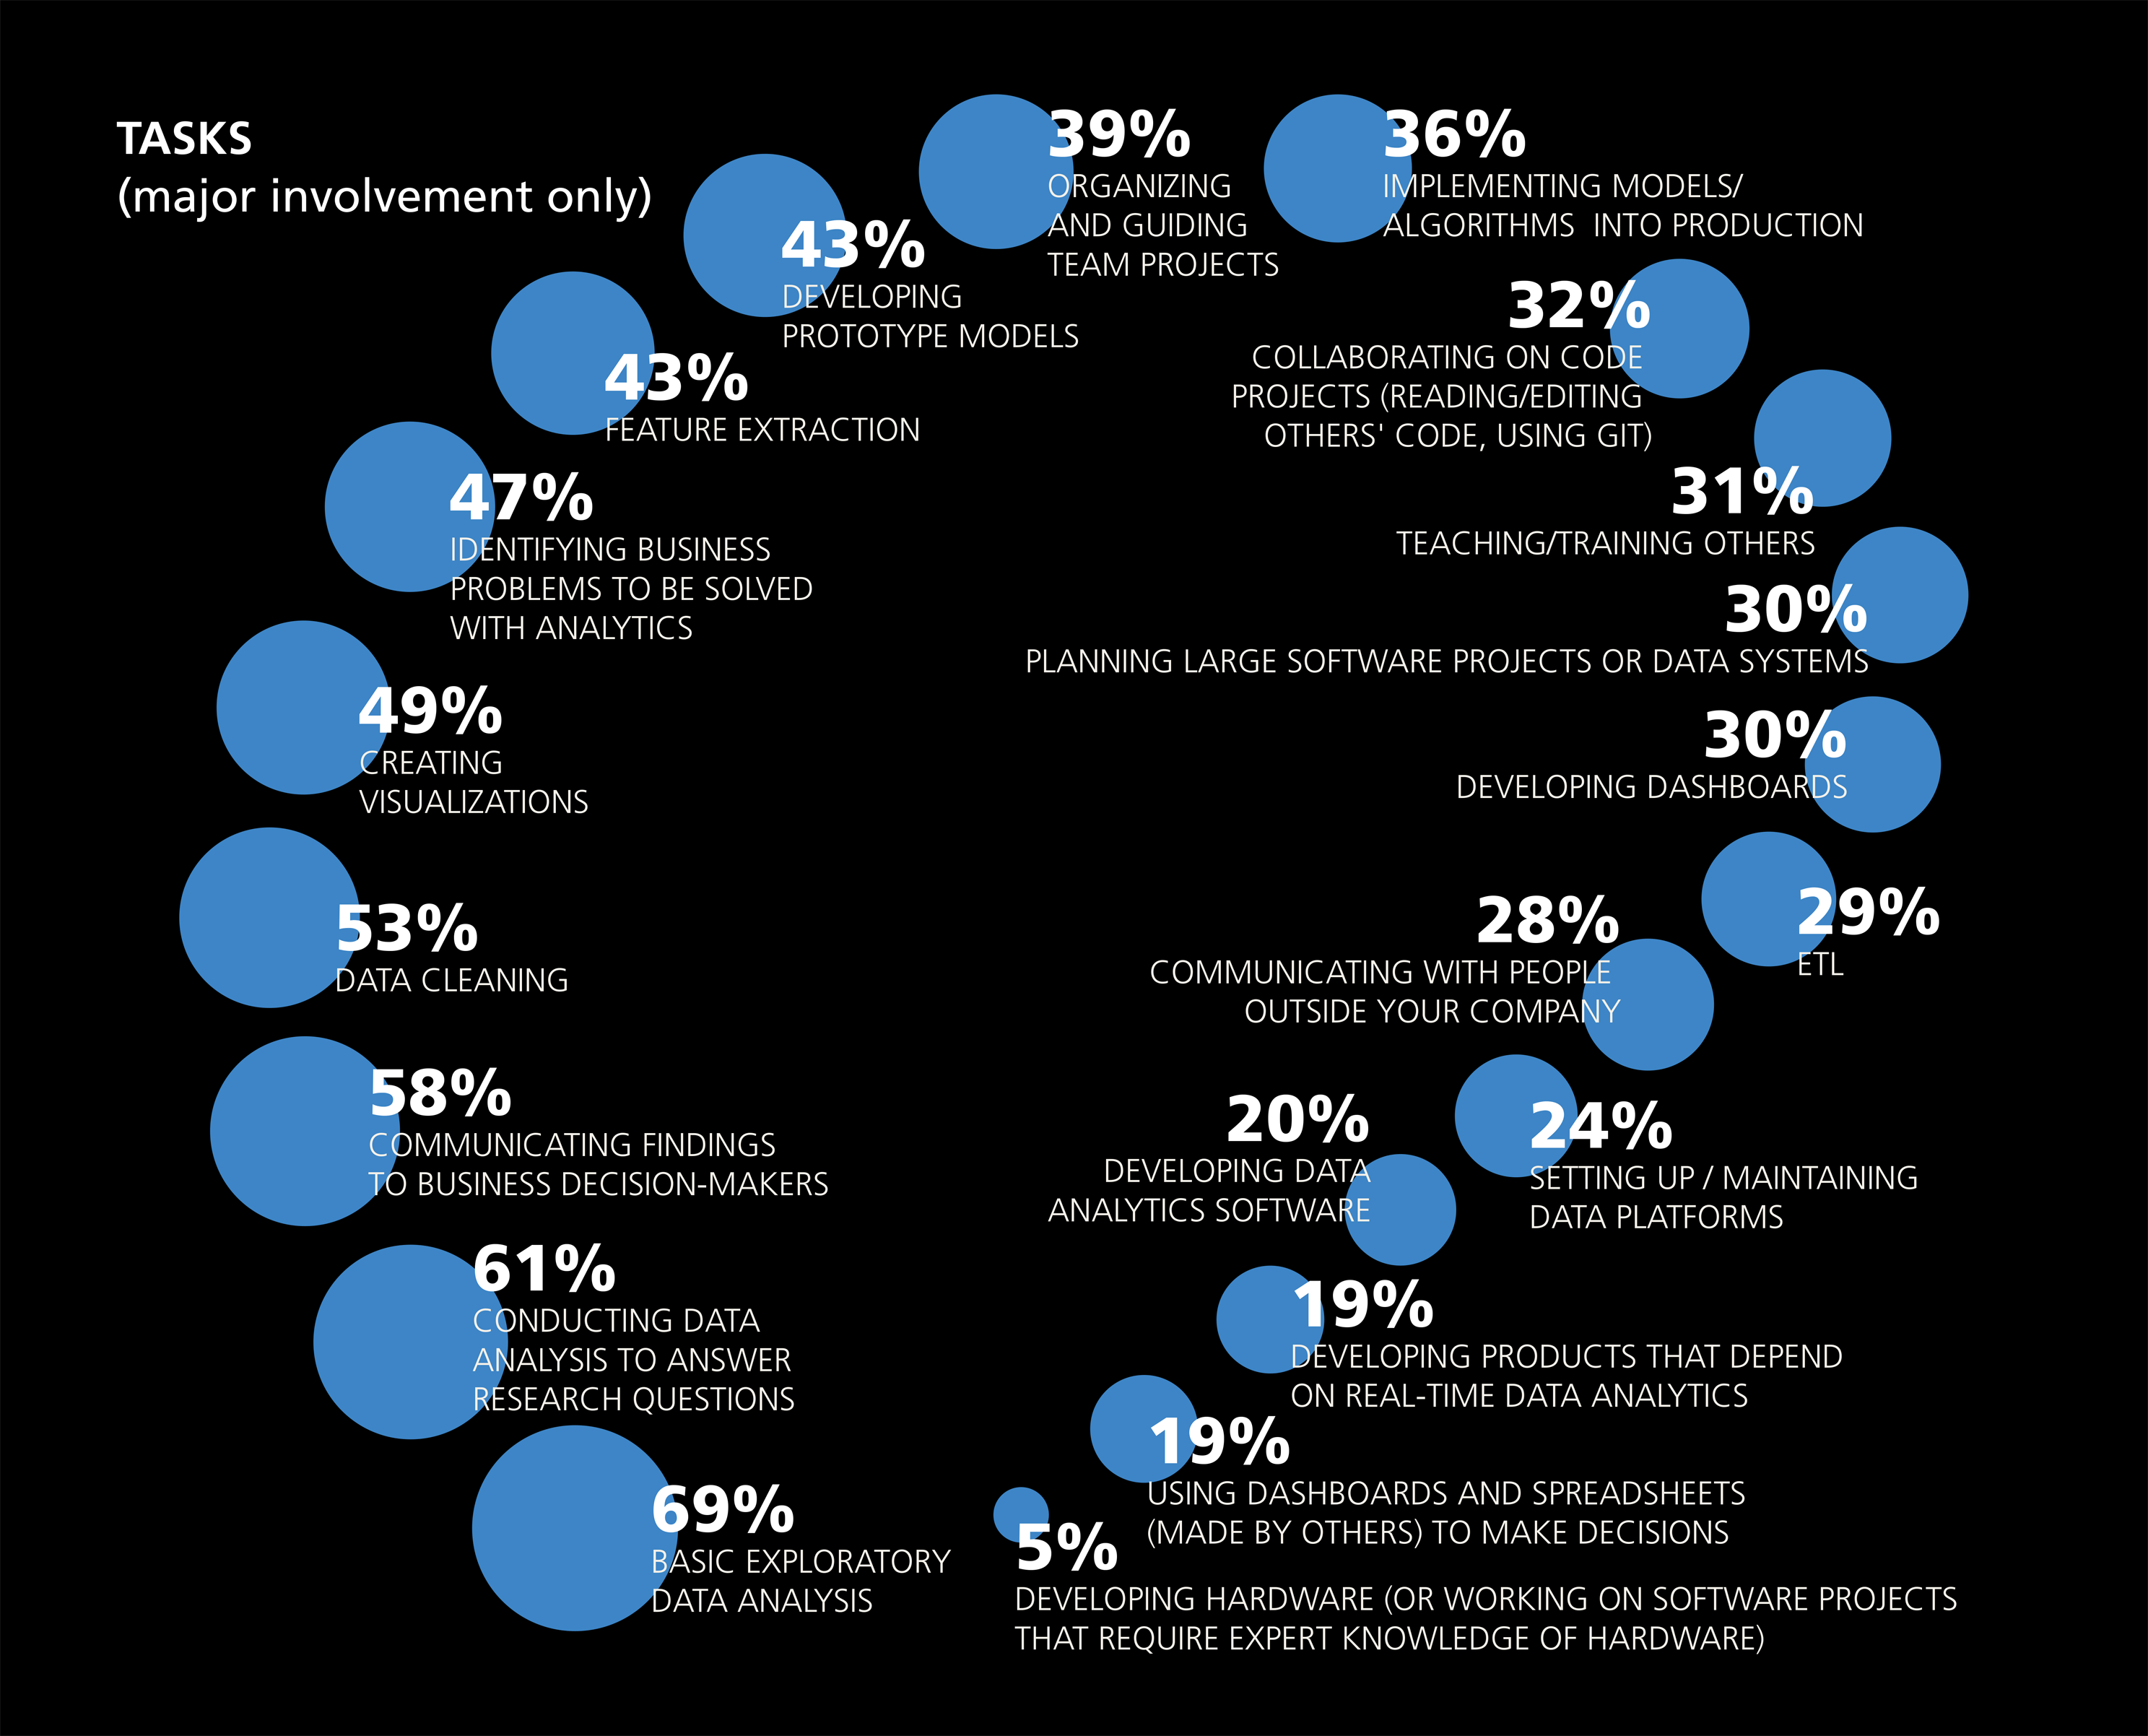
What does a data scientist do?
The chart below is taken from the 2016 Data Science Salary Survey, administered by O'Reilly. They asked respondents what they spend their time doing on a daily basis. What do you notice?
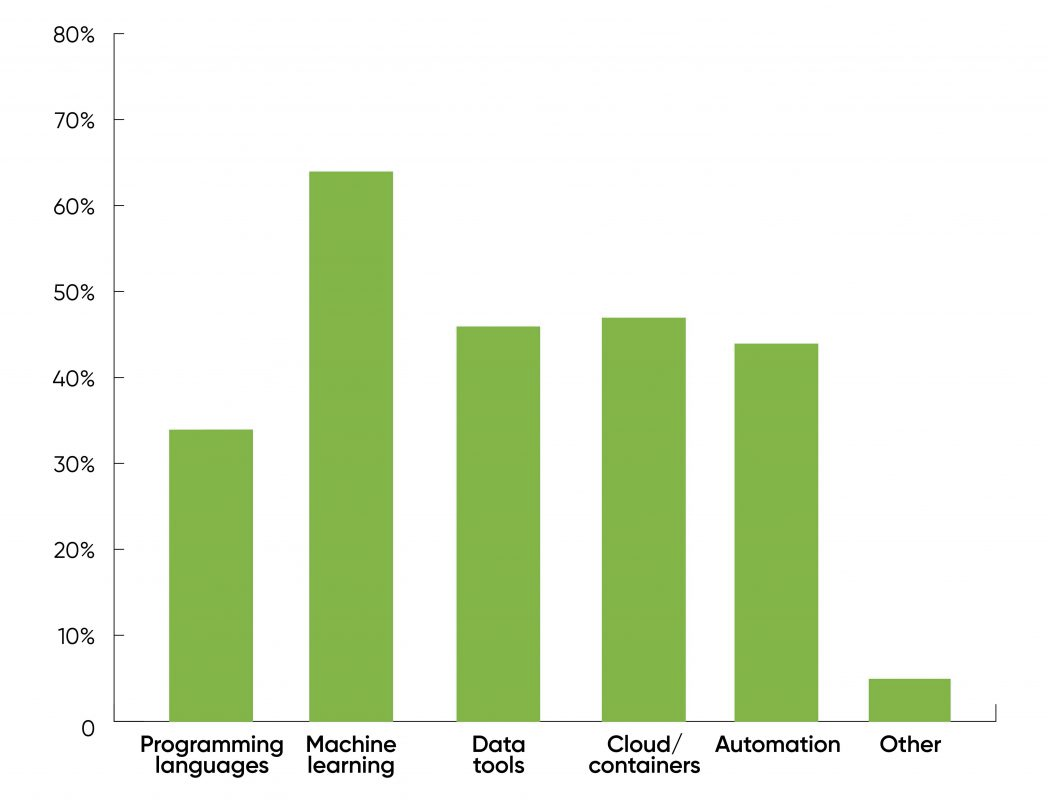
The chart below is taken from the followup 2021 Data/AI Salary Survey, also administered by O'Reilly. They asked respondents:
What technologies will have the biggest effect on compensation in the coming year?
What does a data scientist do?
Our take: in DSC 80, and in the DSC major more broadly, we are training you to ask and answer questions using data.
As you take more courses, we're training you to answer questions whose answers are ambiguous – this uncertainly is what makes data science challenging!
Let's look at some examples of data science in practice.
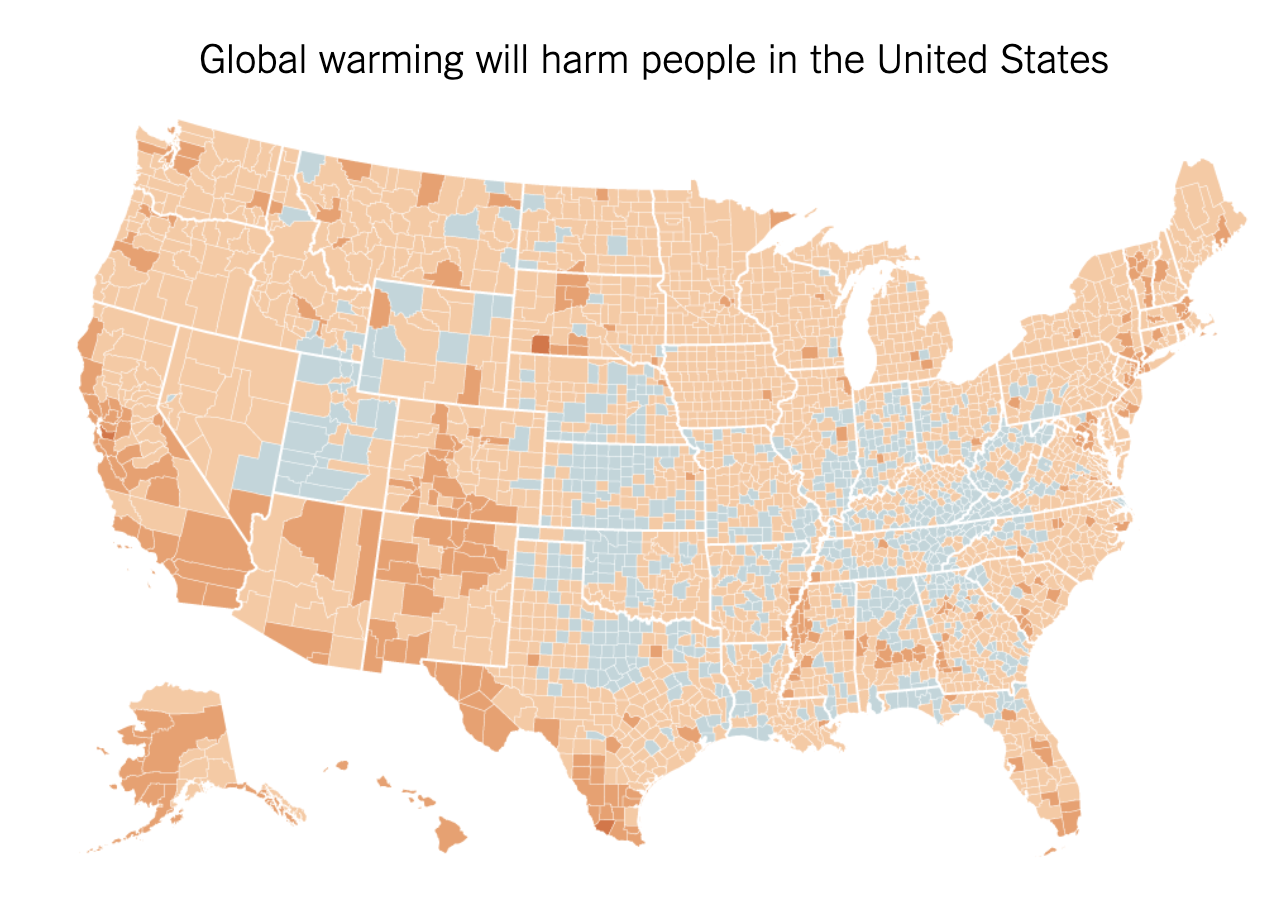
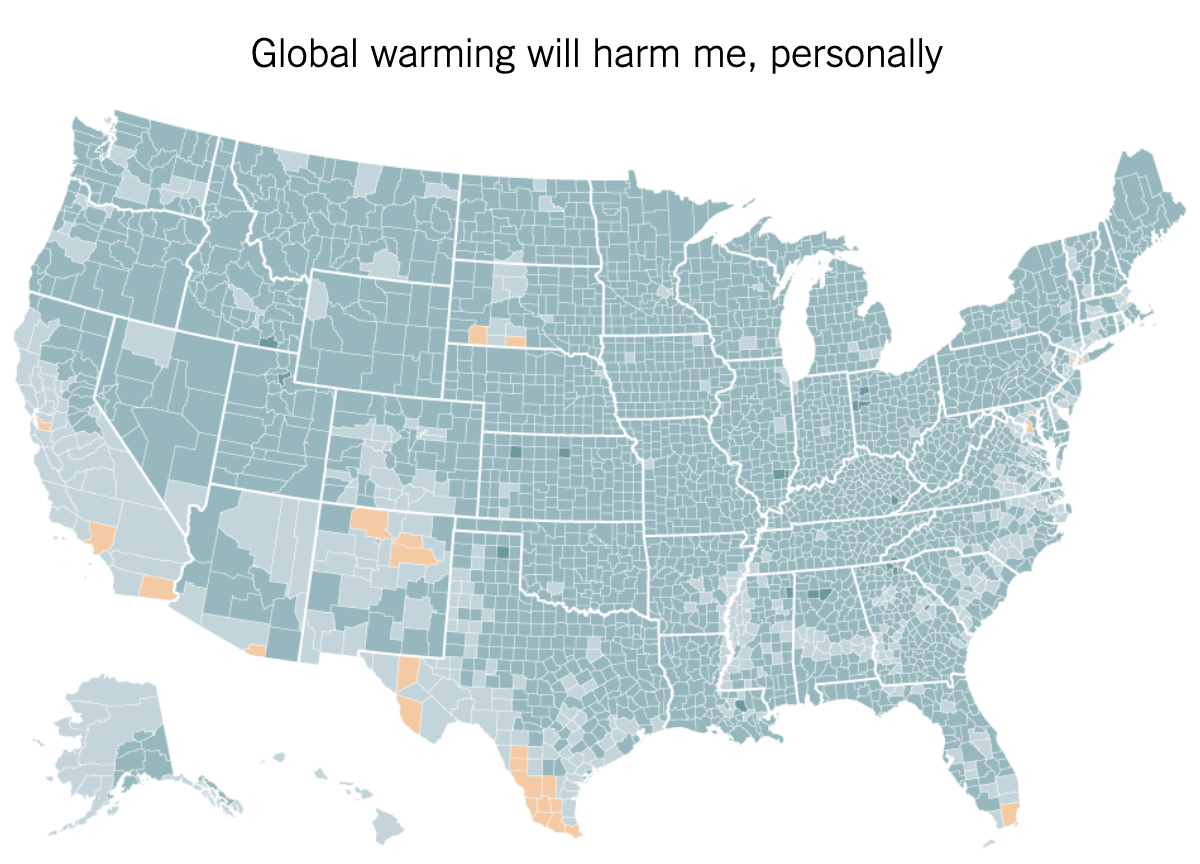
An excerpt from the article:
Global warming is precisely the kind of threat humans are awful at dealing with: a problem with enormous consequences over the long term, but little that is sharply visible on a personal level in the short term. Humans are hard-wired for quick fight-or-flight reactions in the face of an imminent threat, but not highly motivated to act against slow-moving and somewhat abstract problems, even if the challenges that they pose are ultimately dire.
Data science involves people 🧍
The decisions that we make as data scientists have the potential to impact the livelihoods of other people.
- Flu case forecasting.
- Admissions and hiring.
- Hyper-personalized ad recommendations.
What is this course really about, then?
- Good data analysis is not:
- A simple application of a statistics formula.
- A simple application of computer programs.
- There are many tools out there for data science, but they are merely tools. They don’t do any of the important thinking – that's where you come in!
Course content
Course goals
DSC 80 teaches you to think like a data scientist.
In this course, you will...
- Get a taste of the "life of a data scientist."
- Practice translating potentially vague questions into quantitative questions about measurable observations.
- Learn to reason about "black-box" processes (e.g. complicated models).
- Understand computational and statistical implications of working with data.
- Learn to use real data tools (and rely on documentation).
Course outcomes
After this course, you will...
- Be prepared for internships and data science "take home" interviews!
- Be ready to create your own portfolio of personal projects.
- Have the background and maturity to succeed in the upper-division.
Topics
- Week 1: From
babypandastopandas. - Week 2: DataFrames.
- Week 3: Working with messy data, hypothesis and permutation testing.
- Week 4: Missing values.
- Week 5: HTML and web scraping.
- Week 6: Midterm Exam and regular expressions.
- Week 7: Text data, modeling.
- Week 8: Feature engineering and generalization.
- Week 9: Modeling in
sklearn. - Week 10: Classifier evaluation, fairness, conclusion.
- Week 11: Final Exam
Course logistics
Getting set up
- Piazza: Q&A forum. Must be active here, since this is where all announcements will be made.
- Gradescope: Where you will submit all assignments for autograding, and where all of your grades will live.
- Canvas: No ❌.
In addition, you must fill out our Welcome Survey
Accessing course content on GitHub
You will access all course content by pulling the course GitHub repository:
We will post HTML versions of lecture notebooks on the course website, but otherwise you must git pull from this repository to access all course materials (including blank copies of assignments).
Environment setup
- You're required to set up a Python environment on your own computer.
- To do so, follow the instructions on the Tech Support page of the course website.
- Once you set up your environment, you will
git pullthe course repo every time a new assignment comes out. - Note: You will submit your work to Gradescope directly, without using Git.
- We will post a demo video with Lab 1.
Lectures
- Lectures are held in-person on Tuesdays and Thursdays 9:30am-10:50am in PCYNH 106. Lectures are podcasted.
- Assignment deadlines are fairly flexible (as I'll explain soon).
Assignments
In this course, you will learn by doing!
- Labs (20%): 9 total, lowest score dropped. Due Wednesdays at 11:59PM.
- Projects (25%): 4 total, no drops. Due on Fridays at 11:59PM.
In DSC 80, assignments will usually consist of both a Jupyter Notebook and a .py file. You will write your code in the .py file; the Jupyter Notebook will contain problem descriptions and test cases. Lab 1 will explain the workflow.
Late Policy
- No late submissions accepted, but...
- Extension Request Form grants you 1 day extension on assignment submission (instead of slip days).
- We will essentially approve all requests!
- Goal is to help support you if you start falling behind, so if you fill out form a lot, we'll schedule a meeting with you to help come up with a plan for success.
- No extensions on project checkpoints or Final Project.
Redemption for Labs and Projects
- All labs and projects 1-3 have hidden autograder tests.
- We won't show you what you missed until the deadline has passed.
- But you can resubmit after the original deadline to redeem up to 80% of points lost.
Discussions
- Discussion classes this quarter will be held by the TA: 10:00AM-10:50AM in HSS 1330!
- Will post worksheets with suggested past exam questions to try out that week.
Exams
This class has one Midterm Exam and one Final Exam. Exams are cumulative, though the Final Exam will emphasize material after the Midterm Exam.
Midterm Exam: Tuesday of Week 6 (during lecture)
Final Exam: Location and time will be declared.
Both exams will be administered in-person. If you have conflicts with either of the exams, please let us know on the. There will be an exam accomodation form that will be released.
Your final exam score can redeem your midterm score (see the Syllabus for details).
| Monday | Tuesday | Wednesday | Thursday | Friday |
|---|---|---|---|---|
| Lecture | Lecture | |||
| Lab due | Project due |
🏃♂️💨💨💨
Resources
- Your main resource will be lecture notebooks.
- Most lectures also have supplemental readings that come from our course textbook, Learning Data Science. These are not required, but are highly recommended.
Support 🫂
It is no secret that this course requires a lot of work – becoming fluent with working with data is hard!
- You will learn how to solve problems independently – documentation and the internet will be your friends.
- Learning how to effectively check your work and debug is extremely useful.
- Learning to stick with a problem (tenacity) is a very valuable skill; but don't be afraid to ask for help.
Once you've tried to solve problems on your own, we're glad to help.
- We have several office hours in person each week. See the Calendar 📆 for details.
- Piazza is your friend too. Make your conceptual questions public, and make your debugging questions private.
Generative Artificial Intelligence
- We know that tools, like ChatGPT and GitHub Copilot, can write code for you.
- Feel free to use such tools with caution. Refer to the Generative AI section of the syllabus for details.
- We trust that you're here to learn and do the work for yourself.
- You won't be able to use ChatGPT on the exams, so make sure you understand how your code actually works.
The data science lifecycle 🚴
The scientific method
You learned about the scientific method in elementary school.
However, it hides a lot of complexity.
- Where did the hypothesis come from?
- What data are you modeling? Is the data sufficient?
- Under which conditions are the conclusions valid?
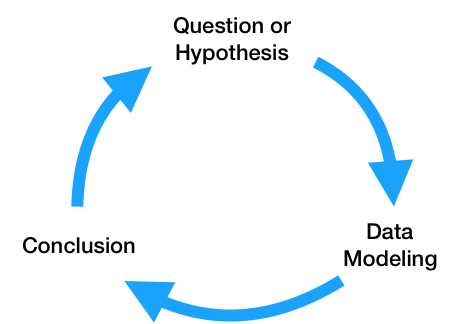
The data science lifecycle

All steps lead to more questions! We'll refer back to the data science lifecycle repeatedly throughout the quarter.
Example: What's in a name?
Lilith, Lilibet … Lucifer? How Baby Names Went to 'L'
This New York Times article claims that baby names beginning with "L" have become more popular over time.
Let's see if these claims are true, based on the data!
The data
What we're seeing below is a pandas DataFrame. The DataFrame contains one row for every combination of 'Name', 'Sex', and 'Year'.
baby = pd.read_csv('data/baby.csv')
baby
| Name | Sex | Count | Year | |
|---|---|---|---|---|
| 0 | Liam | M | 20456 | 2022 |
| 1 | Noah | M | 18621 | 2022 |
| 2 | Olivia | F | 16573 | 2022 |
| ... | ... | ... | ... | ... |
| 2085155 | Wright | M | 5 | 1880 |
| 2085156 | York | M | 5 | 1880 |
| 2085157 | Zachariah | M | 5 | 1880 |
2085158 rows × 4 columns
Recall from DSC 10, to access columns in a DataFrame, you used the .get method.
baby.get('Count').sum()
np.int64(365296191)
Everything you learned in babypandas translates to pandas. However, the more common way of accessing a column in pandas involves dictionary syntax:
baby['Count'].sum()
np.int64(365296191)
How many unique names were there per year?
baby.groupby('Year').size()
Year
1880     2000
1881     1934
1882     2127
        ...
2020    31517
2021    31685
2022    31915
Length: 143, dtype: int64
A shortcut to the above is as follows:
baby['Year'].value_counts()
Year
2008    35094
2007    34966
2009    34724
        ...
1883     2084
1880     2000
1881     1934
Name: count, Length: 143, dtype: int64
Why doesn't the above Series actually contain the number of unique names per year?
baby[(baby['Year'] == 1880)]
| Name | Sex | Count | Year | |
|---|---|---|---|---|
| 2083158 | John | M | 9655 | 1880 |
| 2083159 | William | M | 9532 | 1880 |
| 2083160 | Mary | F | 7065 | 1880 |
| ... | ... | ... | ... | ... |
| 2085155 | Wright | M | 5 | 1880 |
| 2085156 | York | M | 5 | 1880 |
| 2085157 | Zachariah | M | 5 | 1880 |
2000 rows × 4 columns
baby[(baby['Year'] == 1880)].value_counts('Name')
Name
Grace      2
Emma       2
Clair      2
          ..
Evaline    1
Evalena    1
Zula       1
Name: count, Length: 1889, dtype: int64
How many babies were recorded per year?
baby.groupby('Year')['Count'].sum()
Year
1880     201484
1881     192690
1882     221533
         ...
2020    3333981
2021    3379713
2022    3361896
Name: Count, Length: 143, dtype: int64
baby.groupby('Year')['Count'].sum().plot()
"'L' has to be like the consonant of the decade."
(baby
 .assign(first_letter=baby['Name'].str[0])
 .query('first_letter == "L"')
 .groupby('Year')
 ['Count']
 .sum()
 .plot(title='Number of Babies Born with an "L" Name Per Year')
)
What about individual names?
(baby
 .query('Name == "Siri"')
 .groupby('Year')
 ['Count']
 .sum()
 .plot(title='Number of Babies Born Named "Siri" Per Year')
)
def name_graph(name):
    return (baby
     .query(f'Name == "{name}"')
     .groupby('Year')
     ['Count']
     .sum()
     .plot(title=f'Number of Babies Born Named "{name}" Per Year')
    )
name_graph('Luna')
What about other names?
name_graph('Alexa')
This week...
- Lab 1 will be released tomorrow.
- Start setting up your environment, which you'll need to do before working on Lab 1.
- Also fill out the Welcome Survey and read the Syllabus!